
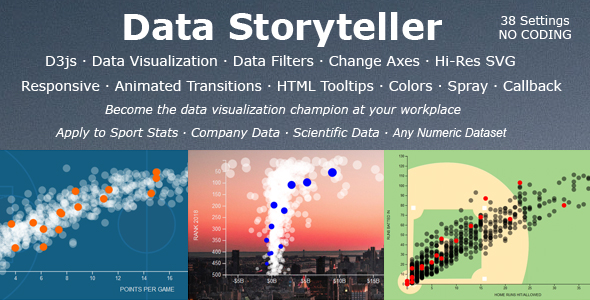
Data Storyteller v1.0 – Responsive SVG Bubble Chart Visualization (D3js & jQuery)
$3.99
- Very cheap price & Original product!
- 100% Clean Files & Free From Virus
- Unlimited Domain Usage
- Lifetime free updates !!!
| DEMO LINK |
This and 8000+ plugins, themes, and PHP scripts can be downloaded as a premium member for only $10!
Not a member? Become a Premium Member Now!
Description
- Help users visualize and understand numeric data in an engaging and fun way
- Help users see patterns, relationships and outliers in the data
- Apply to any numeric dataset (company data, scientific data, sports data, etc.)
- Assign data columns in your CSV file to X and Y axes
- Crisp, high resolution SVG
- Responsive or fixed dimensions
- Quickly locate slices of data in the visualization using filters
- Filters are automatically created from the CSV data file
- Animated transitions – when the user changes the X or Y axis, the data bubbles animate/transition in the visualization
- Tooltips – there are default tooltips, but you can optionally create an HTML template that pulls in the underlying data
- Callbacks – optionally add your own code to take action when the user clicks a bubble or selects a filter (with full access to the data associated with those bubbles from the underlying CSV file)
- Create multiple data visualizations on the same HTML page
- 6 examples included. Modify/add configuration options … then copy/paste into your HTML page.
- Easy to use … no programming
1 review for Data Storyteller v1.0 – Responsive SVG Bubble Chart Visualization (D3js & jQuery)
You must be logged in to post a review.
Related products
-

Green Forms v1.56 – Standalone Form Builder
Original price was: $23.00.$3.99Current price is: $3.99. -

Active Workdesk CMS v3.3.0
$4.00 -

phpShort v45 – URL Shortener Platform
Original price was: $49.00.$3.99Current price is: $3.99. -

Booking Core v3.6.2 – Ultimate Booking System
$4.00 -

Puerto Family Tree Builder SAAS v1.5.4
Original price was: $34.00.$3.99Current price is: $3.99. -

WoWonder Desktop v3.4 – A Windows Messenger For WoWonder Social Script
Original price was: $39.00.$3.99Current price is: $3.99. -
![GoBiz v5.2.0 [Activated] – Digital Business Card + WhatsApp Store Maker |SaaS |Card Builder](https://gplsouq.com/wp-content/uploads/2021/11/codecan-gobiz-banner-new-347x177.jpg)
GoBiz v5.2.0 [Activated] – Digital Business Card + WhatsApp Store Maker |SaaS |Card Builder
Original price was: $39.00.$3.99Current price is: $3.99. -

LiveSmart Video Chat v2.0.38
$3.99 -

Malware Scanner v2.3 – Website Files Scanner
Original price was: $15.00.$3.99Current price is: $3.99. -

Hellaplus v1.4 – Income and Expense Tracker for Individuals & Businesses
Original price was: $49.00.$3.99Current price is: $3.99. -

eCommerce v6.0 – Advanced online store solution
Original price was: $29.00.$3.99Current price is: $3.99. -

Font Awesome Pro v6.6.0
Original price was: $99.00.$3.99Current price is: $3.99. -

Ajax Chat System
Original price was: $12.00.$3.99Current price is: $3.99. -

eClass LMS Certificate Addon v1.0
$4.00 -

Nimble Messaging v2.5.5 – Professional SMS Marketing Application For Business
Original price was: $49.00.$3.99Current price is: $3.99. -

Apk Download Google Play Store v2.1 – Laravel Admin
Original price was: $38.00.$3.99Current price is: $3.99. -

Premium URL Shortener v7.6.3 – Link Shortener, Bio Pages & QR Codes
$4.00 -

Digit v3.0.6 – Responsive WHMCS Client Area Template
Original price was: $49.00.$3.99Current price is: $3.99. -

Essentials & HRM (Human resource management) Module for UltimatePOS (With SaaS compatible) v5.1
Original price was: $54.00.$3.99Current price is: $3.99. -

Quform v2.5.2 – Responsive Ajax Contact Form
Original price was: $9.00.$3.99Current price is: $3.99.
Sigurd (verified owner) –
Cheap and effective solution